Jul 05, 2021
Eurex
Part I: From headwinds to tailwinds – a reversal in fortune for the FTSE 100?
by Sandrine Soubeyran, Director Research & Analytics, FTSE Russell
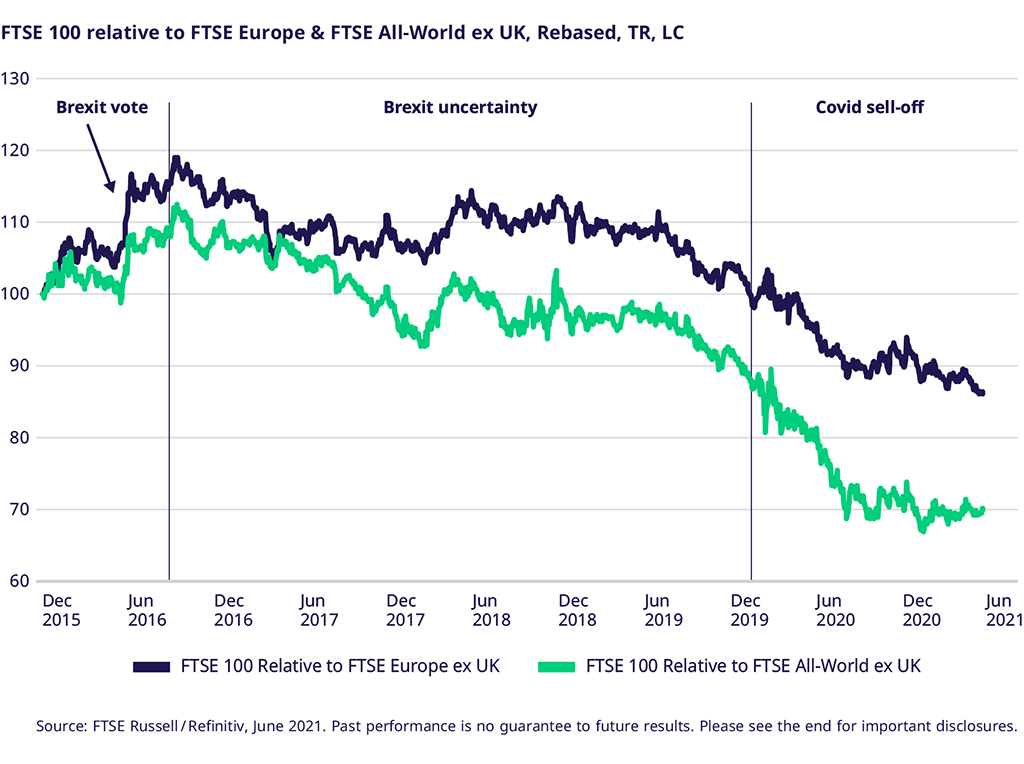
The U.K. equity market has suffered from structural underperformance since 2016. We can see this from the cumulative relative performance of the FTSE 100 Index against European and global equities in local currency terms. The underperformance began as the U.K. prepared to vote on its exit from the European Union. As can be observed, the large-cap U.K. market has significantly underperformed over the period, with Brexit uncertainty and the Covid shock as the two major headwinds during this period.

How did this affect the U.K. equity market valuation?
The persistent underperformance of the FTSE 100 means that the U.K. now stands out for its wide valuation differentials with other regions, having cheapened substantially over the last five years. In the next chart, we compare the 12-month forward PE ratio across regions. The UK FTSE 100 multiple is now in line with its 10-year average (13.0 vs 13.5x), in absolute terms, whereas all other regions’ forward PEs stand at sizeable premia to 10-year averages. Similarly, the FTSE 100 currently retains a sizable discount on a relative basis, as shown by the current relative (0.67) versus average relative (0.84) results in the table below.

The value versus growth rotation?
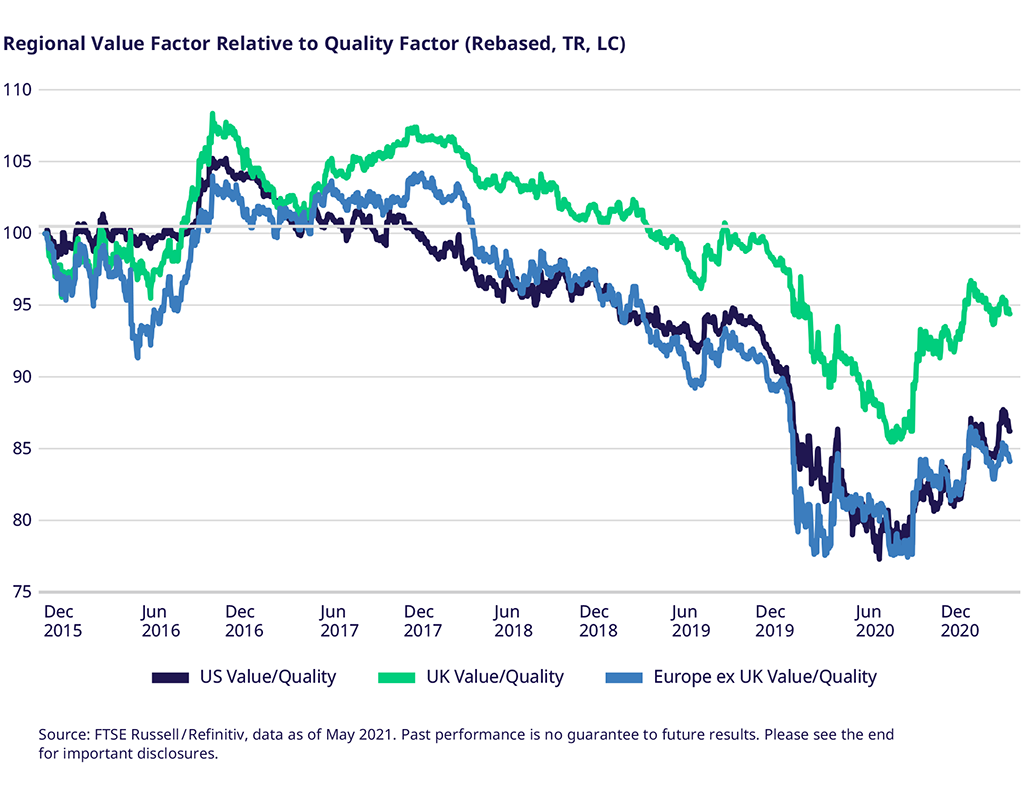
As we examine the causes of the FTSE 100 underperformance, we see that value has underperformed growth stocks since 2017 in the U.S., U.K. and Europe, as shown in the chart below. Only recently, since the reflation trade in Q4 2020, has this trend reversed, with value generally outperforming in recent months.

The U.K.’s industry composition has been the biggest challenge to performance
Dissecting industry performance by looking at the sector-weighted contributions reveals the huge contribution from US technology since 2016. In the U.K., the standout contributing industry was basic materials.

U.K. equity underperformance highlights key sectoral differences
Comparing the industry exposure of the UK market with its European and U.S. counterparts highlights clear differences in composition. The histogram shows that consumer staples, commodities and financials account for nearly 60% of the U.K. equity market, while in turn, the U.K. has limited exposure to technology (1%). This contrasts with the U.S. market, where technology is a much more substantial sector, with a 27% exposure. In Europe, industrials, health care and financials make up about half of the FTSE Europe ex UK Index, and, like the U.K., it is also underweight technology, though to a lesser extent

In conclusion ‒ where does this leave the U.K. equity market?
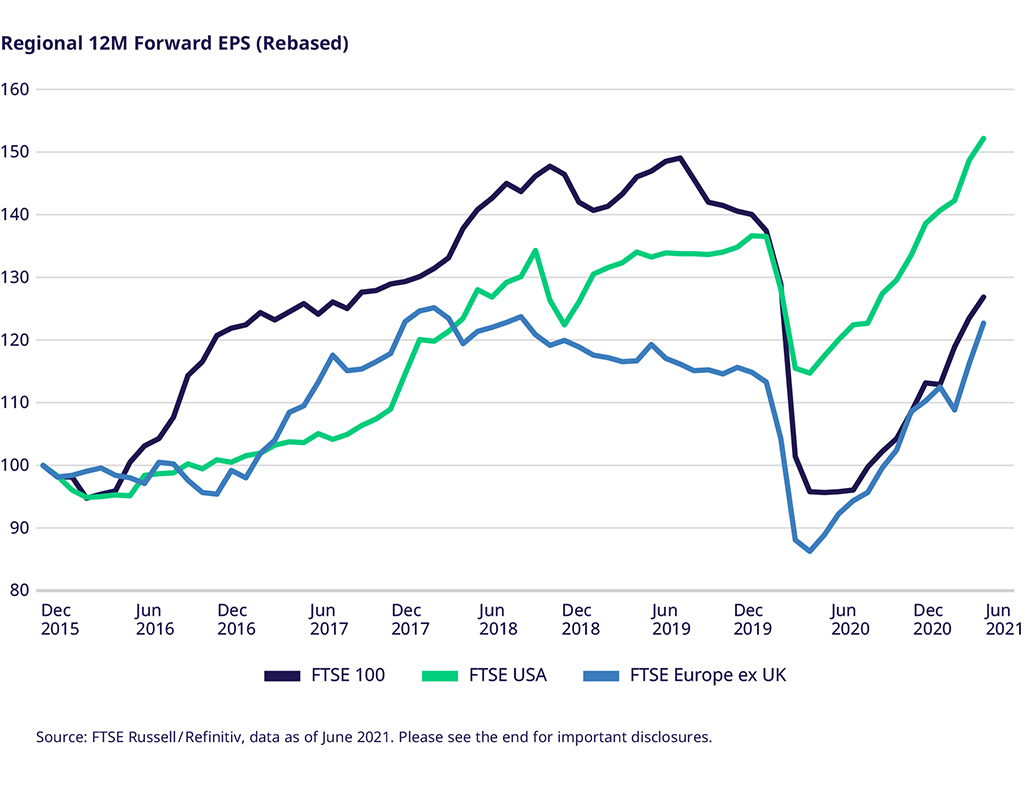
Today, the U.S. and U.K. lead the EPS growth recovery outlook for 2021, and along with Europe, have enjoyed large upgrades in their 12-month EPS estimates. As the rotation into value gets underway, the U.K. benefits from its industry exposure to cyclically sensitive sectors, notably in basic materials (see industry exposure in the chart above).

Central bank GDP upgrades after vaccine rollout success
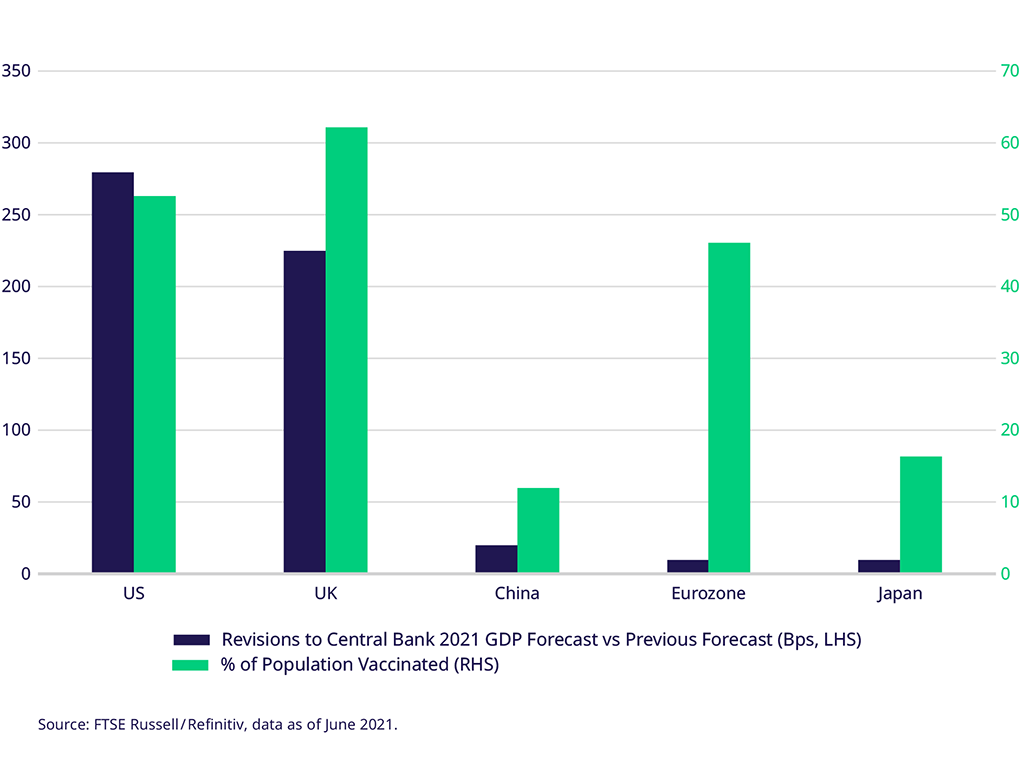
The latest central bank GDP forecasts highlight differences in growth prospects between countries after the pandemic, with notable upgrades in the U.S. and U.K., after successful vaccine rollouts. (China’s forecast was upgraded more modestly but is above 6% after success in resisting a major second wave.)

Success in vaccine rollouts, especially in the U.K. and U.S., the re-opening of the economy, and the Biden fiscal stimulus program largely account for recent central bank growth upgrades.

Other valuation metrics also show FTSE 100 undervalued versus other markets
Finally, in addition to positive economic growth prospects, the CAPE ratio (cyclically adjusted price-to-earnings ratio) helps assess whether a market is undervalued or overvalued, pointing to the FTSE 100 as being currently below its 10 and 20-year averages. In contrast, the CAPE of other markets is either around historical averages or well above (notably the U.S.).

This article was first published at FTSE Russell.
© 2021 London Stock Exchange Group plc and its applicable group undertakings (the “LSE Group”). All rights reserved. FTSE Russell® is a trading name of FTSE, Russell, FTSE Canada, MTSNext, Mergent, FTSE FI, YB and BR. All information is provided for information purposes only. All information and data contained in this publication is obtained by the LSE Group, from sources believed by it to be accurate and reliable. Any representation of historical data accessible through FTSE Russell products is provided for information purposes only and is not a reliable indicator of future performance. No member of the LSE Group nor their respective directors, officers, employees, partners or licensors provide investment advice and nothing contained in this document or accessible through FTSE Russell Indexes, including statistical data and industry reports, should be taken as constituting financial or investment advice or a financial promotion. Past performance is no guarantee of future results. Charts and graphs are provided for illustrative purposes only. Index returns shown may not represent the results of the actual trading of investable assets. This publication may contain forward-looking assessments. These are based upon a number of assumptions concerning future conditions that ultimately may prove to be inaccurate.
