- After August’s turmoil, markets normalized very quickly in September
- However, exiting September, several potential catalysts, both good and bad, are occurring. From geopolitical conflict to massive Chinese stimulus to US growth concerns
- Are the options markets allowing investors to hedge at attractive prices?
Monthly Volatility Update
There were similarities and differences in markets' price action in September vs. August. You recall the aggressive sell-off in early August that may have cut some family vacations short. September started in the same fashion, with sharp moves lower in the early part of the month as investors were back to work full-time and conference season was starting across the globe. Growth concerns in the US hurt US stocks, particularly the high-flying tech stocks, early in the month, giving rise to a sell-off in other markets. However, as rate cuts were priced into the futures curve, equity stabilized with money rotating into sectors that would do well in a stimulative monetary environment.
Some of the biggest beneficiaries across market sectors were real estate stocks, where lower interest rates were providing a tailwind, and utility stocks, where the demand for power from AI was driving performance. This is not the typical combination of sectors that you would see leading stocks back to all-time highs, yet it was the sector performance driving markets in Europe and the US.
As the month wore on, sectors we might expect to lead in a cyclical rebound started to take hold of performance. Basic Resources, Retail and Financials led the charge in Europe, presumably with a stronger global growth focus on the horizon.
As September ended, it proved as confusing as it had begun, perhaps due to conflicting signals from escalations in Russia/Ukraine and the Middle East on the one hand and massive fiscal stimulus in China on the other. With so much potential volatility and uncertainty about the direction, one might presume this would be an optimal time for owning options. But was it?
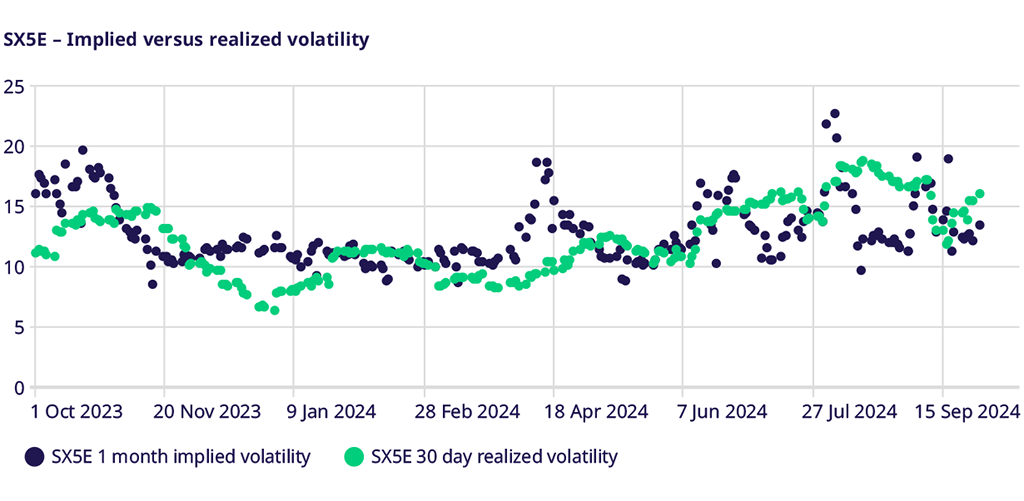
Over the course of September, we saw SX5E options volatility consistently decline. The highest implied volatility readings came early in the month, particularly right after the US Labor Day holiday when global stock markets were at their weakest. However, with a slow grind higher during the rest of the month, implied volatility steadily lowered.
At the end of the month, implied volatility had a small uptick as uncertainty around future direction re-asserted. You may notice from the chart above that realized (historical) volatility stayed persistently high throughout September. As we exited the month, realized volatility was well above implied volatility. Does this suggest there is an opportunity for traders to find options that may carry well in the current environment and have the positive convexity exposure to the catalysts that appear to be presenting as we exit the month? That is how it appears on the surface. There may be the opportunity to be long gamma that carries well and protects against large moves in either direction.
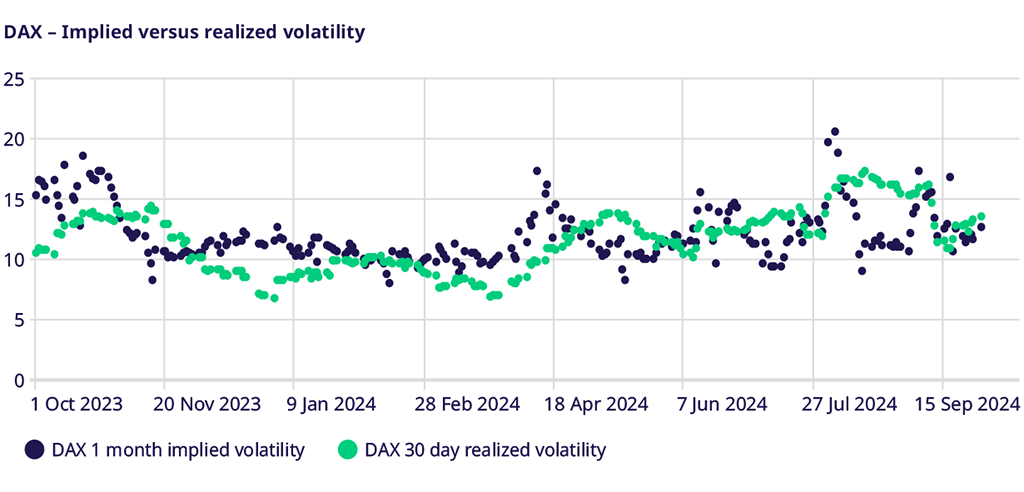
The DAX options market has been much more sporadic of late. In August, we saw large differences between the 1-month implied volatility and the trailing 30-day realized volatility, with implied volatility ending the month of August looking particularly cheap. However, as September moved along, we saw a re-connection between implied and realized volatility, making the two levels virtually indistinguishable on the chart when we exited the month. Traders who took advantage of the disconnect that existed last month would have clearly benefitted. However, as we look at levels at the end of September, the opportunity in DAX options does not look as clear as it did at the end of August or as it does in other markets.
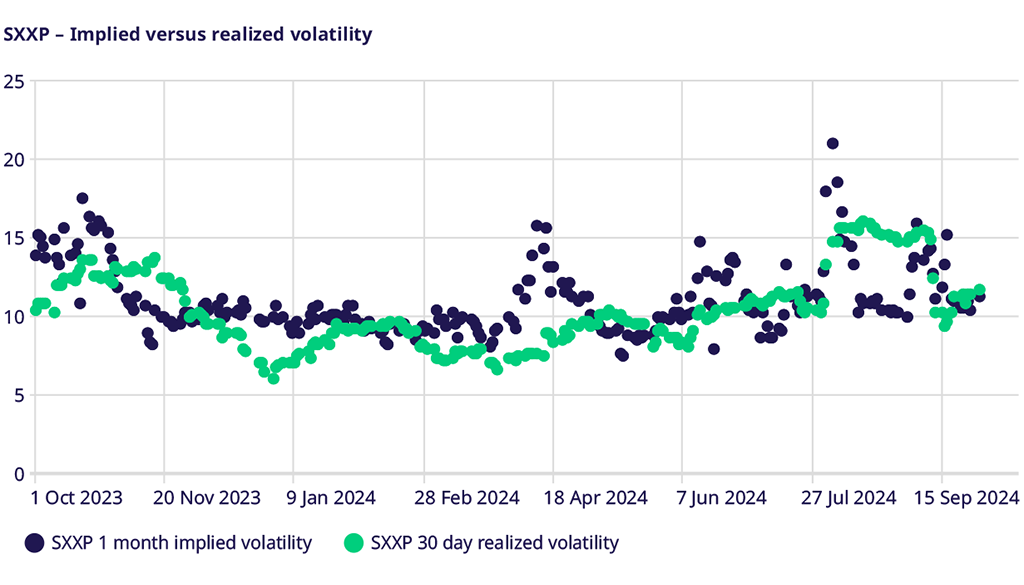
The experience in SXXP options looks much more similar to the DAX options market for the past month than in the SX5E options market. A large dislocation in implied volatility at the start of the month, which was corrected and came in line by the end of the month, was the norm. As we exit the month of September, there is very little difference between SXXP implied and realized volatility. As such, a trader would need to have a stronger view of the direction of the underlying market in order to see where there might be an opportunity in the options market. If one is bearish on the price action in the market, the options might still present an attractive entry level. However, in the absence of a bearish conviction, or if one is bullish, there may be no clear trade in options short of an over-write strategy into earnings, with implied and realized general in the same price area.
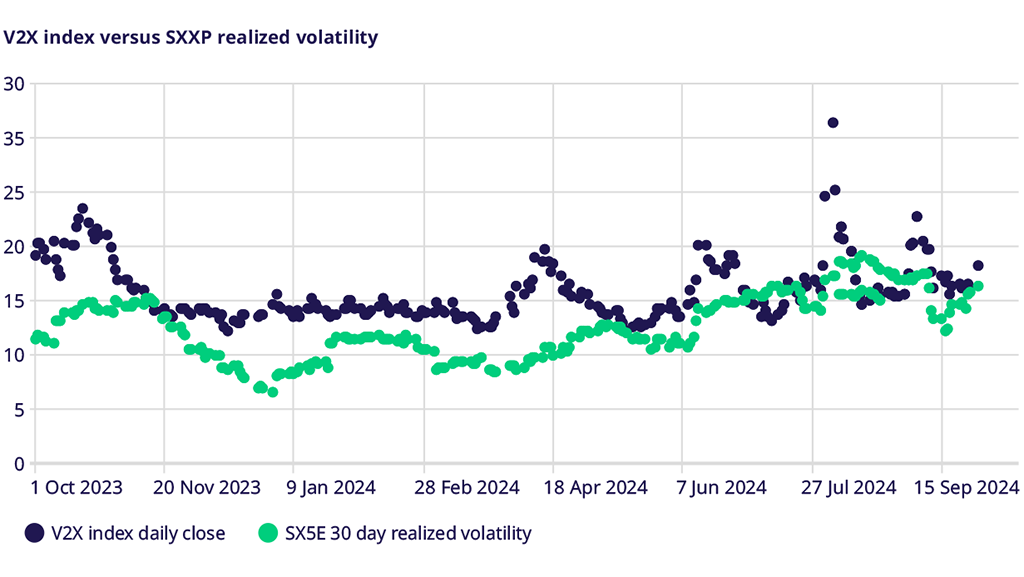
V2X market dynamics have gotten very interesting for traders. Looking back to changes made by Eurex at the start of August:
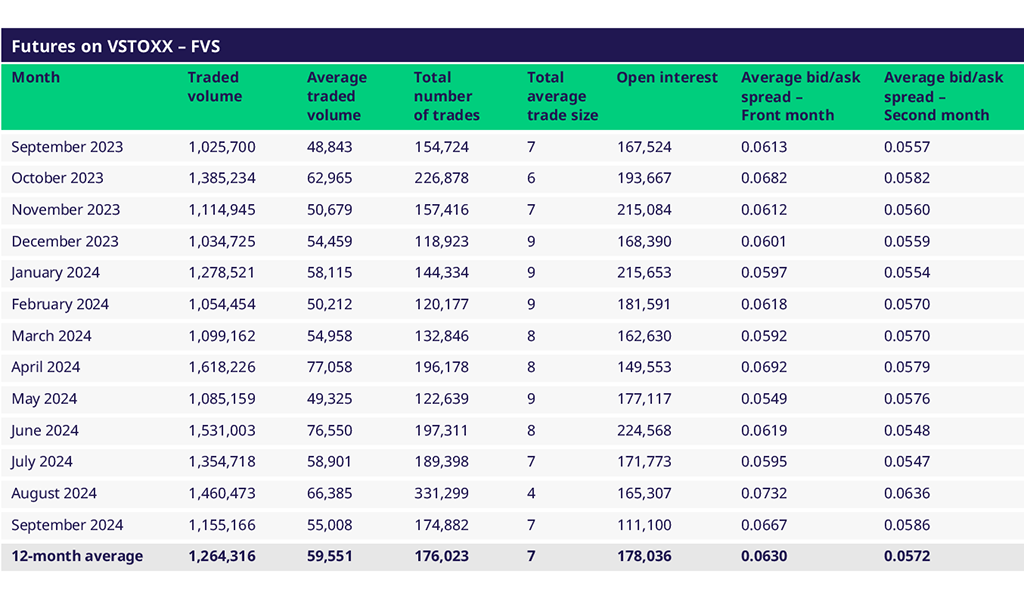
New liquidity schemes for both VSTOXX® futures and options took effect at the start of the month (August). Just a few days into these new programs, both schemes appear to show early success in tightening spreads and improving depth in the order book. Historically, less than 8% of VSTOXX options (OVS) volumes are traded in the order book. So far, after the scheme change, 41% has traded in the order book. Week-over-week volume is +128% for futures and +83% for options.
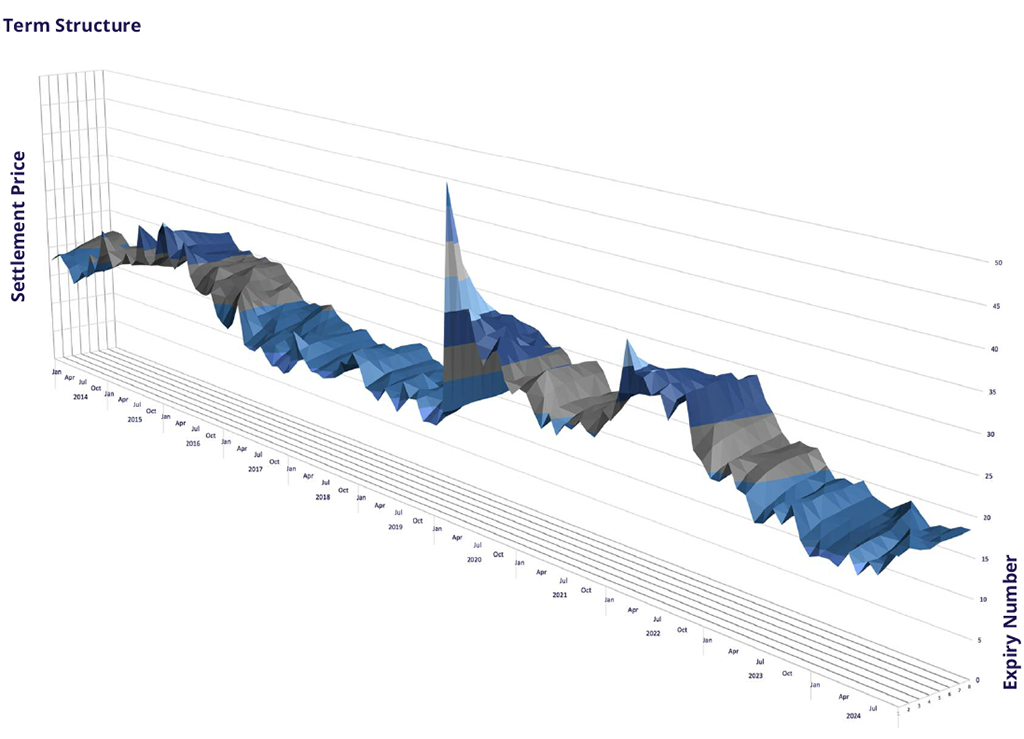
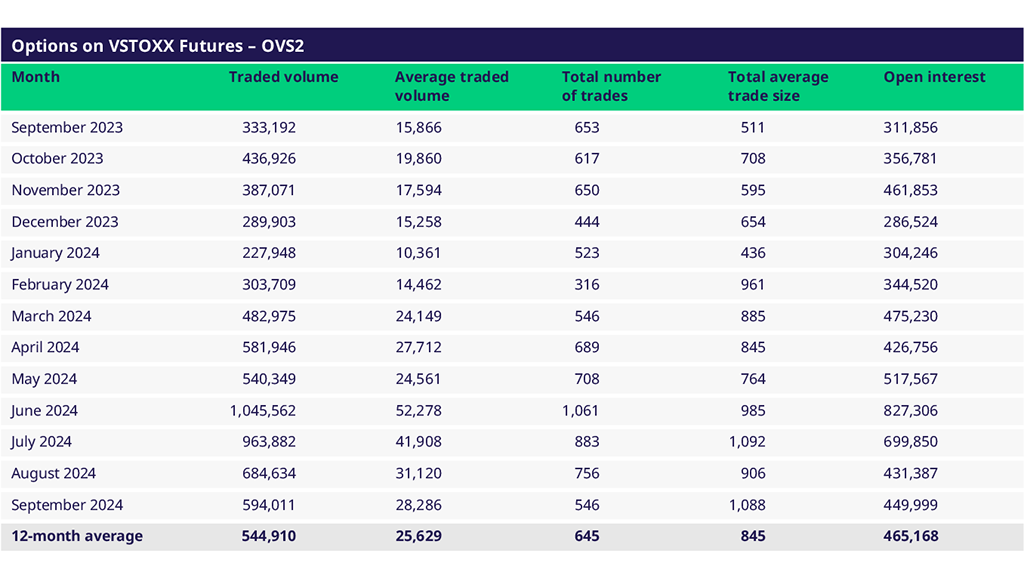
Traders may already see the benefits in the V2X options market from the changes made. Volume and open interest in V2X options are steadily increasing, improving the opportunity set for traders. Comparing the V2X level vs. the realized volatility of the SX5E index, meaningful differences throughout August have normalized somewhat into September. However, V2X may still appear attractively priced relative to the actual movement in the SX5E market, particularly when considering the massive convex opportunities in trading V2X options vs. the index options alone. With the market uncertainty we referenced before, one might expect to see V2X levels much higher relative to the realized movement. That simply hasn’t been the case, and it may present an opportunity for traders and investors alike.
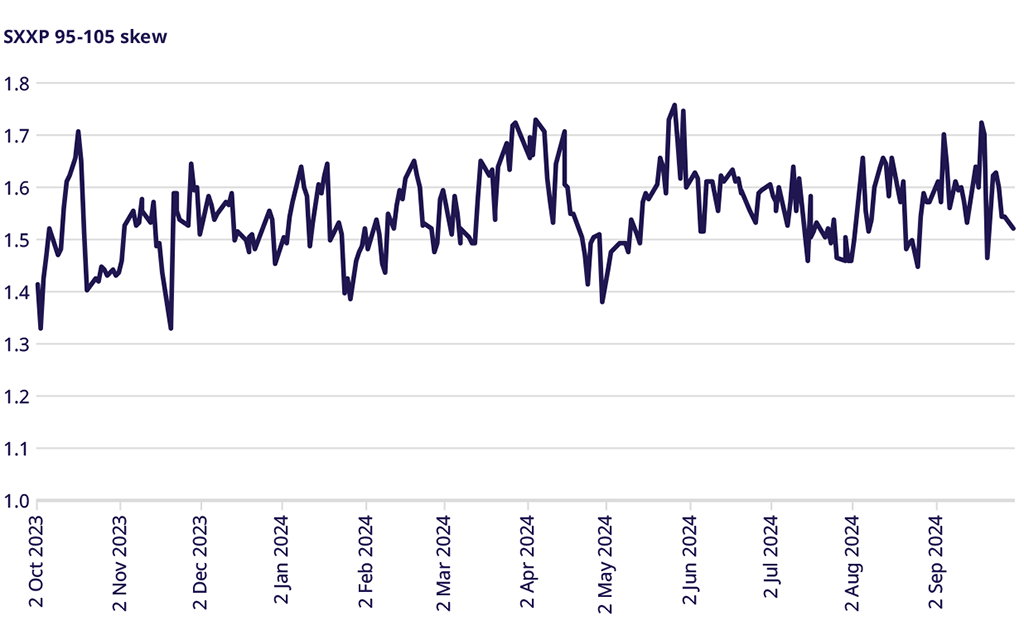
Finally, let’s look at the skew in the SXXP Index. As we can see, the 1-month 95-105 skew ranged between 1.4 and 1.7 in the past year, with a mean not far from 1.55. In September alone, we touched both the low and the high end of that range, and as we end the month, we are below the median. For investors and traders weighing to hedge their portfolios for macro uncertainty and consider collars, the relative pricing of puts to calls appears somewhat attractive based on the levels we have seen over the past year.
Volatility Views Podcast
Listen to the newest edition of the podcast by "The Options Insider" and get more information on this week's volatility markets and the VSTOXX® review and outlook.
For more information, please visit the website or contact:


