18 Feb 2025
Eurex
Focus on VSTOXX® Derivatives | January 2025 recap
With a 6.29% gain, January 2025 was one of the top three Januarys since the Great Financial Crisis across Europe, trailing only 2015 at 7.16% & 2023 at 6.67%
As markets rally, there may be less demand for downside protection but instead more interest to overwrite positions, with falling skew pressuring implied volatility
Implied volatility fell close to realized volatility levels, though V2X still shows some risk premium priced into the market
SX5E Index - a compressing of the implied to realized spread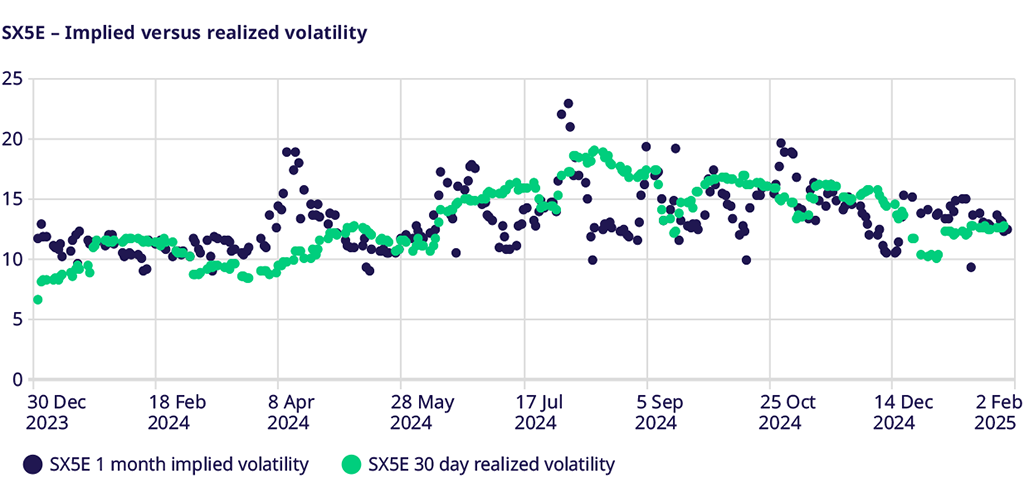
January was a month of unwinding some of the holiday effects seen in the options market and witnessing the convergence of implied and realized volatility. As the market closed 2024, there was the expectation or potential for some news that could potentially move markets. Thus, after a sell-off of implied volatility before December expiration, volatility moved higher and ended the month near month’s highs even though the realized volatility remained subdued by holiday trading. In January, trading volumes returned to normal, with realized volatility increasing 2.5 vol points higher throughout the month. After continuing to move higher and peaking near 15 early in January, implied volatility fell slightly and closed the month slightly above 12, at a slight discount to the realized volatility of the markets. With earnings season beginning, traders’ focus may be shifting to single-stock volatility instead of index volatility.
DAX markets - a strong monthly performance limits the fall of implied vol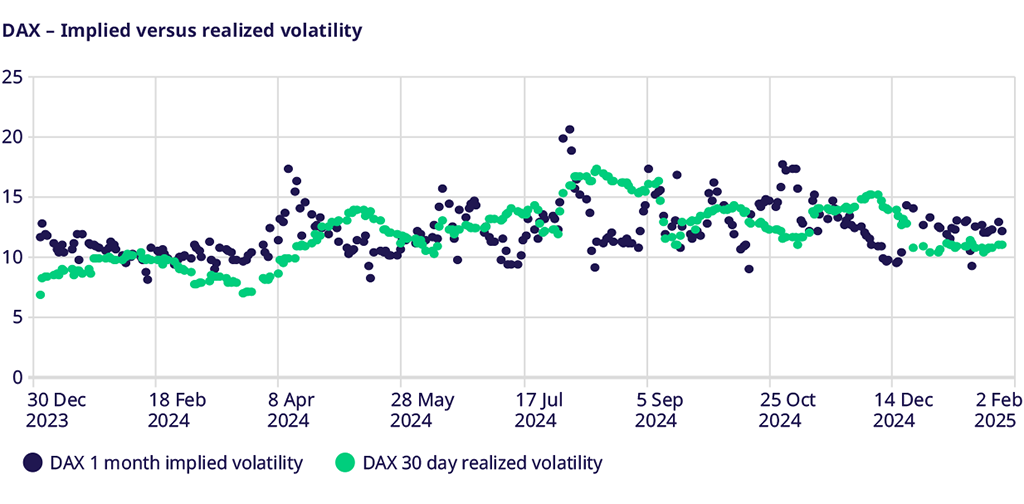
At the end of 2024, it looked like the DAX’s outperformance vs. other European indices was beginning to wane. Price action throughout the month showed that it was too early to call for an end to that trend, with the DAX Index moving considerably higher throughout the month and finishing up more than 9% in January. This performance was more than 100 bps better than most other indices. The options market responded by bringing implied volatility lower over the month, consistent with a move higher in the market. There was a limit to how much lower implied volatility could fall, as the realized volatility was high enough to support gamma hedging and keep implied volatility near 12. That said, the spread between implied and realized volatility did compress from 3 vol points to 1 vol point with strong price action potentially leading to a desire to overwrite more positions. Implied volatility ended the month only slightly lower than the two-year average.
SXXP Index – strong price action leads to lower implied volatility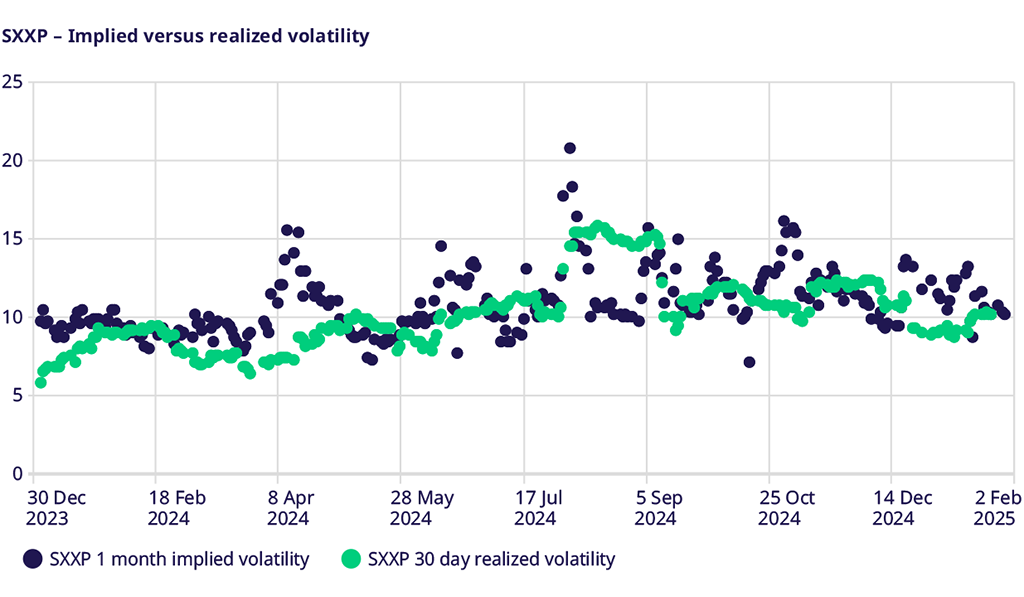
January 2025 will be remembered for the strong price action across the market. It ended with the STOXX® 600 up 6.29%, its third-best January performance, and one of the best monthly performances since the Great Financial Crisis. As futures rallied, the desire for insurance waned, and the potential for overwriting the upside increased. As a result, the supply of options outpaced the demand, and implied volatility ended the month in single digits, even below the realized volatility that markets experienced. Thus, there was virtually no risk premium built into implied option markets, signaling that traders and investors see the European stock market breakout as something that potentially has more legs to it. While implied volatility has been lower at points over the past year, it is rare to see implied volatility trade at a discount to realized volatility with geopolitical risk still strong and earnings about to begin. Is this an opportunity for volatility traders?
V2X Index – down on the month but still elevated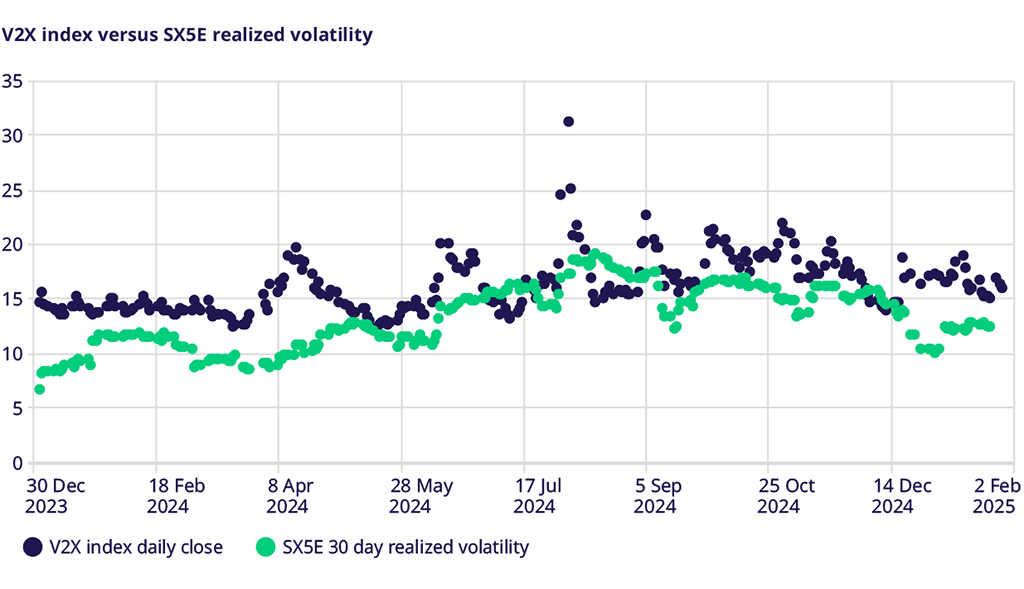
There are two ways to think about the month’s V2X Index moves. On the one hand, a trader could say the absolute level of the V2X is lower from the end of December; thus, traders must be more comfortable with risks in the market. On the other hand, a trader could point to the spread between the V2X Index and SX5E Index realized volatility and point out that this option risk premium widened throughout the month. It may depend on your preference, but the risk premium is very real, with the V2X index ending at 15.36 at the end of January, down from 17 at the end of December but well above the 12.68 level of realized volatility. Traders still see some risks on the horizon, either from the geopolitical risks of a new US administration threatening tariffs, a new AI force coming out of China, or an economy potentially not behaving as central bankers expected, reducing expectations of rate cuts. This risk premium is the key metric to watch as February begins.
SXXP Index Skew – near 12-month lows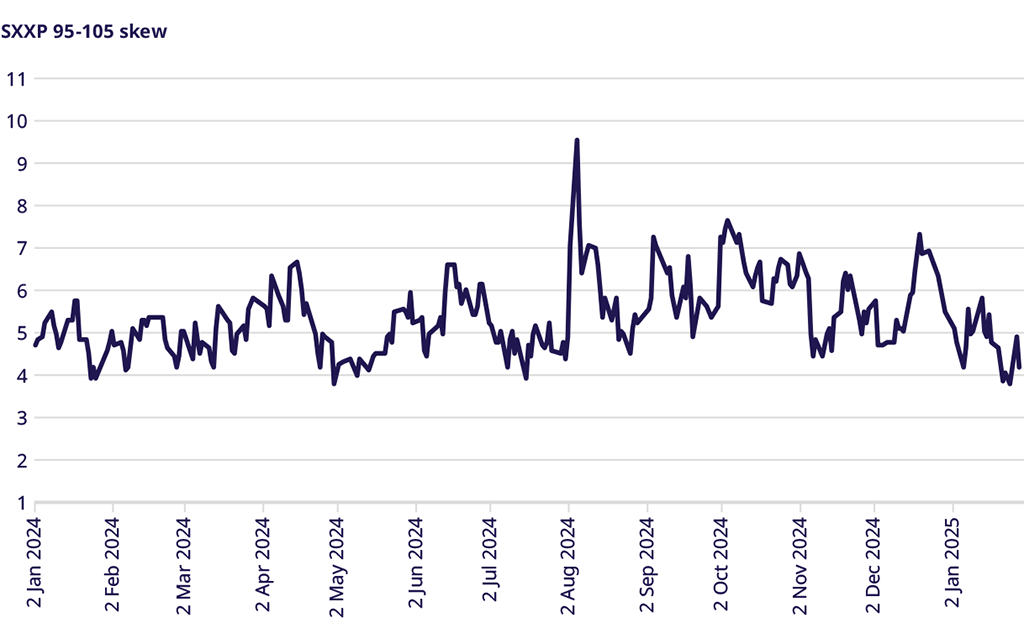
SX5E Index skew levels end January 2025 near the lows of the past year. In many ways, this should not be a surprise. Underlying European index markets had one of their best January performances since the Great Financial Crisis. In this type of market, traders typically do not think about hedging downside risks and may be more focused on generating some income from selling upside, thinking markets moved a little too far, too fast. It is hard to take positions to cash with futures breaking out across the board; thus, the relative supply/demand of the different options strategies has brought skew lower. The interesting point of skew is that traders have not seen skew moving higher as markets move higher yet, the so-called sticky skew. This typically happens when markets move into uncharted territory and short-term traders look for upside leverage. Is this something we may see as February begins?
Trade the European volatility benchmark
Explore this year's macro events and find an overview of dates.
Volatility Views Podcast
Listen to the newest edition of the podcast by "The Options Insider" and get more information on this week's volatility markets and the VSTOXX® review and outlook.
For more information, please visit the website or contact: